Artificial intelligence has recently experienced a remarkable increase in attention, following staggering achievements in applications such as image, text and speech recognition, self-driving cars or chess and Go tournaments. It is therefore not surprising that also the financial industry is ever more heavily trying to improve investment decisions by incorporating self-learning algorithms into the investment process. For that matter, the application of quantitative tools and algorithms in order to define systematic trading strategies has already a strong history in the hedge fund industry. Against this backdrop, quantitative hedge funds may provide a fertile soil for the application of new machine learning techniques. But do all sectors of the asset management industry exhibit characteristics that can be exploited by artificial intelligence tools to uncover new patterns? What could be the especially relevant fields? Are there limits beyond which additional computing power and greater data availability have only marginal benefits? This research note provides some initial answers. It shows that the adaptivity and self-learning capability of machine learning tools could add value along the entire value chain of an asset manager. However, the inherently flexible nature of machine learning methods is also the biggest challenge. These methods must be applied thoughtfully and in the right context. We start with a general overview of machine learning, then elaborate on specific applications in quantitative asset management, highlighting the limitations, challenges and possible remedies before reaching our conclusions.
From machine learning in general…
Machine learning refers to extracting knowledge from data by identifying correlated relationships without receiving prior information about what causal dependencies to look for. It combines elements from both statistics and computer science and has been in existence for many years. As early as 1956, John McCarthy at a conference on the campus of Dartmouth College coined artificial intelligence as “the science and engineering of making intelligent machines”. However, it is mostly due to recent significant advancements in computing power and data availability that the application of artificial intelligence algorithms has become relevant in everyday life.
Most machine learning methods have been developed outside of finance and built on well-known statistical models such as linear regression or clustering techniques. Still, machine learning allows for much more flexibility, for example, by allowing for nonlinearities and feedback effects, or by completely refraining from any prior knowledge about the problem under scrutiny. It can be applied to different kinds of problems, such as classification or regression analysis. Classification algorithms group observations into a finite number of categories, whereas regression analysis estimates outcomes to problems that have an infinite number of solutions. While machine learning is a very broad field, it can be classified into three main areas.
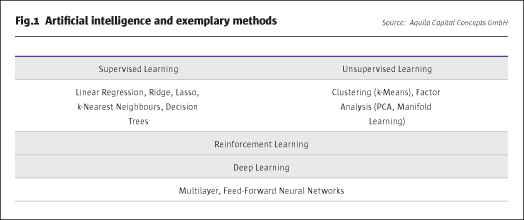
The currently most successful field is supervised learning, where algorithms learn based on training data that reveal known relationships. Examples of supervised learning include tasks such as the detection of fraud in credit card transactions or the creditworthiness of debtors. The simplest form of a supervised learning algorithm is linear regression, which makes a prediction using a linear function of the input features, by learning the relationship based on minimising the mean squared error between predicted and true regression outputs. There is a general trade-off between optimising the fit of a model on the in-sample training and the true out-of-sample prediction period. Given that all models tend to fit the training data better the more input variables are used, it may be reasonable to penalise additional model complexity in order to maintain sufficient generalisation power for the prediction task. Methods such as ridge or lasso regression help in automatically detecting the most relevant input variables by regularising model complexity to avoid overfitting. While the ridge regression relies on minimising the importance of less relevant factors, the lasso regression completely discards input parameters whose importance lies below a certain threshold. All three methods are, by nature, linear, but may account for non-linear relationships based on an appropriate manipulation of the input variables, for example, by interacting themselves or by building polynomials on the original data. A simple machine learning method that is not constrained to linear relations is the k-Nearest Neighbours algorithm. This model looks for the khistorical data points that come closest to the current situation and predicts future values based on these historical “neighbours”. There exist more complex non-linear supervised learning algorithms such as decision trees or random forests, which in essence learn by a sequence of if/else rules that get to the true answer the fastest. However, they are not able to extrapolate or make forecasts outside of the range of the training data.
Contrary to the methods described in the section above, unsupervised learning algorithms only receive input data to learn from, but no information about the output data or relationships. These algorithms therefore detect patterns in the data by identifying clusters of observations that depend on similar characteristics. Machine learning can, for example, be used to identify the main topics in the news flow for a given stock, or to look for a liquid security that mimics the characteristics of an illiquid asset. At the core of unsupervised learning algorithms is the idea of reducing dimensionality by clustering the data or by transforming it into simpler factor representations. Clustering methods partition the input data into subsets that exhibit common characteristics, such that the data points within a cluster share some notion of similarity that decisively discriminates them from the data points in other clusters. Factor analysis, on the other hand, relies on transforming the original data into the most relevant drivers or the most appropriate representation. The principal component analysis, for example, first finds the direction of maximum dispersion in the data, assuming that this dispersion contains most of the information about the first factor driving the data. It then finds the direction in the data that again features the highest dispersion but, at the same time, is uncorrelated to the previously identified factor.
Combining methods of supervised and unsupervised learning results in so-called reinforcement learning, where an algorithm first detects patterns on its own, and then receives feedback from an exogenous source to validate or further guide the learning process. A reward feedback is required for the algorithm to learn a certain behaviour. For instance, self-driving cars can learn collision avoidance by learning from the negative feedback received from crashing into obstacles, or computers can teach themselves the rules of games such as chess or Go. Hence, the reward feedback need not necessarily be provided by a human being.
Artificial intelligence literature also frequently refers to deep learning or neural network algorithms. This kind of method, in a certain sense, mimics the function of the human brain by feeding information through different layers and nodes. It can be applied to all of the three areas outlined above. The simplest form is called multilayer perceptron and can be seen as a generalisation of linear models that perform multiple regression steps. Each node of a certain layer of the network computes a weighted sum of the input information received from the nodes of the foregoing layer and applies a nonlinear function to the result. This process is repeated multiple times until the final output value is calculated. Given that in this setup the information passes through each node only once, such neural networks are also designated feed-forward. There exist more advanced networks to deal with the challenges of simple networks which, for example, also propagate information backwards through the network. Given that even a sketchy synopsis of this field would exceed the scope of this research note, we refer the interested reader to corresponding abundant literature.
…To specific applications in quantitative asset management…
Each sector within the financial industry uses artificial intelligence methods differently and according to their specific needs. Insurance companies, for example, use it among other applications to detect fraud in damage events. Banks count on it to assess credit quality or employ robotic process automation for middle and back office tasks. In wealth management, applications are only just emerging, with a current focus on automatically ensuring regulatory requirements, client segmentation, chatbots to deal with repetitive client requests or portfolio management based on robo advisors. But in what areas of asset management can artificial intelligence provide added value? What problems faced by investment managers may not be solved by such tools?
When we think about modelling the investment process – and about using machine learning algorithms to improve decision making – we can subdivide the value chain into different steps. This allows for a systematic application of models that are appropriate for a specific task. We will provide details of the various steps in the next section, but start with an overview in order to facilitate the synopsis.
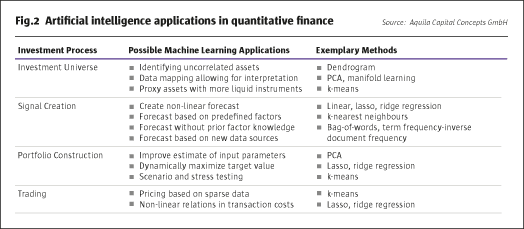
The first step consists of the defining of the investment universe, and of collecting and cleaning the corresponding data sets. Next, the alpha engine or signal engine preprocesses the data in a proper way, calculates the signals for the various markets under scrutiny based on the models used, and maps these signals into the portfolio context. Then, the portfolio construction engine or risk management engine builds the theoretical model portfolio based on a suitable algorithm, such as mean-variance or maximum diversification, taking regulatory and investor specific limits into account. Finally, the trading engine translates changes in the model portfolio positions into effective trades, while routing orders between different market venues, minimising transaction costs and avoiding slippage and market impact. In contrast to our structured approach with clearly defined tasks for the application of artificial intelligence, it would also be possible to more generally ask such an algorithm to completely choose an investment rationale on its own. However, we cover that question in the section that discusses the challenges and limitations of machine learning models.
What then, in more detail, do these general descriptions adhere to? Let us start with the investment universe, where machine learning tools may assist in identifying uncorrelated assets that provide true diversification benefits; or in the mapping of data into new representations that allow for other interpretations, such as the detection of style drifts in hedge fund strategies or, for instance, factor exposures such as momentum or value. An appropriate tool for the first task would, for example, be a dendrogram analysis (see case study 1: Clustering the Investment Universe with Dendrograms); the second goal could be achieved by relying on a principal component or manifold learning analysis. In a similar manner, artificial intelligence methods can be used to proxy valuation or even the actual investment of assets for which there is only sparse historical market data or that are not eligible due to liquidity issues. In the latter case this can be achieved by substituting more liquid instruments that appropriately mimic the characteristics of the desired assets. A useful variant to achieve that task would be the k-Nearest Neighbour model.
The aim of the alpha or signal engine in our context is to generate forecasts about the direction and magnitude of future asset price movements or about the riskiness of assets, and to translate that information into a meaningful signal for the portfolio construction engine. Potential applications of machine learning methods in this field can be classified into three main blocks. First, an artificial intelligence algorithm may be helpful in creating a nonlinear forecast based on a single time-series (see Case Study 2: Analysing the Behaviour of the VIX Index with KNN). Second, machine learning methods may derive forecast value out of a predefined pool of relevant factors.
An elucidatory example would be the dynamic, selective weightings of a given set of moving averages over various time windows, depending on some historical pattern or exogenous factors. More involved is a third application, consisting of letting the model select relevant input signals on its own or access new data sources in order to extract additional information, for example, by clustering social media posts or news announcements in order to construct alternative sentiment indicators based on a bag-of-words or term frequency-inverse document frequency (TFIDF) algorithm.
Based on these forecasts, the portfolio construction or risk management engine calculates target positions, taking regulatory and internal restrictions into account. In this step, artificial intelligence methods may be helpful in improving estimates for input variables such as expected returns or the variance-covariance matrix for large portfolios in the context of limited historical data. This could, for example, be achieved by reducing the dimensionality of the dataset based on clustering algorithms such as a principal component analysis. Instead of optimising the portfolio with respect to a predefined objective function and specific constraints, machine learning tools may also be asked to tweak the portfolio in a more general way. For instance, by dynamically weighting the portfolio components such that risk-adjusted returns as measured by Sharpe ratios or the ratio of average returns to maximum drawdown are maximised. Finally, enhanced scenario analysis tools may improve model validation and stress testing applications.
The trading engine finally translates target positions into effective market orders. This step is especially relevant for large asset managers, as an estimated two thirds of gains on trades are lost due to market impact costs when trading into and out of large position blocks. In this area, artificial intelligence may serve to obtain additional information from sparse historical data or help identify nonlinear relationships in order flow to calibrate trading algorithms based on both nonlinear regression tools and clustering algorithms.
Case Study 1: Clustering the investment universe with dendrograms
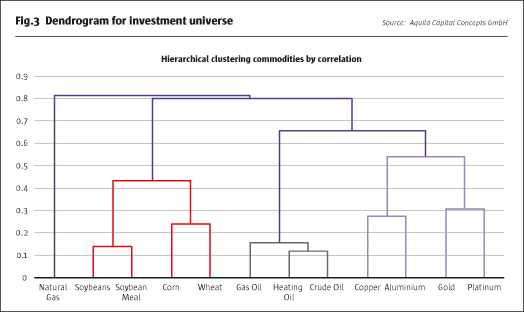
Dendrograms belong to methods of hierarchical clustering. The algorithm iteratively clusters first individual data points and then sub-clusters into a hierarchical order, depending on the correlation
structure.
We use a dendrogram to structure a set of individual commodity markets into more meaningful clusters. Ideally, it comes up with well-known sectors, perhaps energy, precious metals and industrial metals.
At the bottom of the visual representation in Fig.3 are the single data points that are joined in first clusters. For example, the model groups copper and aluminium into a mutual cluster of industrial metals, or gold and platinum into a cluster of precious metals. These two clusters are then joined to form a more general cluster of metals. Similarly, heating oil and crude oil are merged before being clustered together with gas oil to form an energy complex. The energy and metals clusters are then combined to form a cluster of commodities that are highly dependent on changes in the business cycle. The soft commodities – soybeans, soybean meal, corn and wheat – are structured into a separate node that only consists of agricultural products. Interestingly, natural gas forms an individual cluster, most likely because of seasonality factors that separate it from other energy commodities.
Case Study 2: Analysing the behaviour of the VIX index with KNN
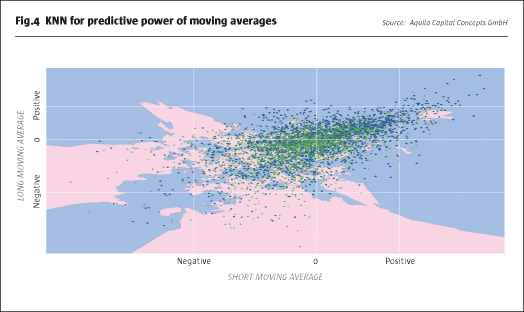
The VIX Index measures market expectations for the volatility of the S&P 500 Index over the coming month, based on index option prices. Given that volatility can neither become negative nor grow boundlessly, theory suggests a mean reverting behaviour. Additionally, the distribution of changes in volatility is commonly skewed, mimicking the fact that spikes in volatility often occur very quickly, while a reduction in volatility normally takes more time and tracks a bumpier road.
Given that backdrop, we analyse the predictive power of two moving averages of past index movements for the future direction of the VIX Index based on a k-nearest neighbour classification algorithm. Fig.4 plots the values of the short moving average on the x-axis and the values of the long moving average on the y-axis. Conditional on the value of these two moving averages, the blue points represent moments in time where the future VIX Index movement was negative, and the green points indicate future positive directional changes. While it is difficult to extract a meaningful interpretation from this scatter plot, a k-nearest neighbour analysis reveals further information. Based on this estimator, Fig.4 shows the decision boundaries for the two states of future directional movements in separate colors. The area coloured in blue represents states where the two moving averages indicate falling VIX levels, whereas the red area stands for scenarios in which the two moving averages predict a rising VIX. Clearly, positive values for the moving averages are related to negative future VIX price movements, confirming a mean reverting behaviour after an increase in volatility levels. The picture for negative moving average values is more ambiguous, overall upholding the thesis of mean reversion, but also showing some signs of momentum. That makes intuitive sense, as volatility tends to trend lower after a sudden spike.
…and Challenges and Limitations
In the previous section, we highlighted various steps along the value chain of a well-structured investment process that, in our view, are suitable for further enhancement by machine learning applications. Does that mean we are unconditional believers in the merits of artificial intelligence? Far from it! There are a number of challenges and limitations that are not necessarily new to quantitative investment managers, which may be aggravated by the flexibility of new techniques.
Artificial intelligence aims to extract relevant knowledge from possibly unstructured data on a self-learning basis. It works especially well for tasks with precisely defined rules and stable probability distributions, such as mastering demanding games like chess or Go. Machine learning tools also perform excellently in piloting self-driving cars, where the necessity to follow roads and traffic rules regulate the set of possible actions. However, the stochastic nature of financial markets with their lack of stable rules and probability distributions may challenge the validity of relationships that are learned from the past. Accordingly, models should always be applied to clearly defined problems and validated against sound theoretical assumptions.
Similarly, self-driving cars can be driven along the same roads as many times as is necessary to teach them all the relevant aspects of a journey and AlphaGo can play with itself until it perfectly masters the rules of the game. However, despite a seemingly abundant access to data, there is only one historical price trajectory for each financial market to train a model on. This limited data availability restricts the complexity of the artificial intelligence model that can be applied and, therefore, the flexibility of the model’s output when forecasting future price movements. This problem is further deteriorated by the fact that the vast majority of data for financial markets has only been collected recently. As a consequence, researchers should focus on parsimonious model structures and not be misled by the mightiness of artificial intelligence models to adaptively learn the past.
Next, machine learning models excel at identifying relationships in data that may be unrecognisable to the human eye by revealing complex correlation structures. Still, they lack the causal reasoning and imagination that would be necessary to anticipate events that have not happened in the same way many times before. Would a trading model based on artificial intelligence have been able to predict the currency peg break between the Euro and the Swiss franc brought about by the Swiss National Bank in early 2015? Did quantitative models foresee the taper announcement by the US Federal Reserve Bank in the spring of 2013? Most likely not. In a similar manner, machine learning algorithms may just find theories that are already well-known and proven. While this confirmation may add comfort, it may also just be a waste of time and money. So, despite increasing computer power and data availability, it is necessary to keep in mind that quantitative models remain a simplified transformation of the world and will only have forecasting ability that is limited to specific tasks. Additionally, the complexity of calibrating artificial models requires a diligent analysis as to where to allocate resources and model power most effectively.
Other more general potential limitations include future regulation and susceptibility to manipulation. While the former may limit the use of data due to calls to protect privacy rights or fears of market infrastructure instability caused by black box models and automated trading processes, the latter may, for example, threaten the validity of contaminated information retrieved from fake social media user accounts or blogs posted by manipulated chatbots. It is worth checking the likely future accessibility of a data source and the way it is comprised before basing investment models on it.
Conclusion
This research note is aimed at providing a framework for assessing the opportunities and challenges of artificial intelligence methods within a structured investment process. It highlights that machine learning tools, owing to their adaptivity and self-learning capabilities, may add value along the entire value chain of an asset manager in two specific ways. First, by more effectively using currently available data based on algorithms that learn to reveal new, nonlinear relationships or by transforming data into representations with more interpretable meanings. Second, by embracing new data sources that provide additional information, for example, based on news flow and blog posts. However, the inherently flexible nature of machine learning methods is also their biggest challenge. It requires that the methods are put in the right context and thoughtfully applied so as to solve questions in a way that produces meaningful outcomes. It would be illusory to believe that artificial intelligence can develop a profitable investment rationale on its own. Accordingly, we are convinced that machine learning will most likely not turn out to be a holy grail, but that it will help quantitative investment managers in further improving their allocation processes. Nevertheless, the use of artificial intelligence in asset management is undoubtedly still at an early stage. This research note, consequently, provides evidence based on first experiences, but no final results. We are looking forward to an exciting future.
- Explore Categories
- Commentary
- Event
- Manager Writes
- Opinion
- Profile
- Research
- Sponsored Statement
- Technical
Commentary
Issue 130
Artificial Intelligence
Chances and challenges in quantitative asset management
AQUILA CAPITAL
Originally published in the March 2018 issue