Alternative asset management is a growing industry, where investors seek diversification to their traditional long only investment portfolios. According to PWC, a significant increase in the assets under management (AuM) of alternatives is anticipated over the next quinquennium, reaching the levels of $15.3tn with hedge funds expected to contribute one third to that amount, which means an increase of $2tn in their AuM. Main drivers of this increase are risks associated with the geopolitical environment of investments. Major determinants of the new risk framework are Brexit discussions, major country elections and Euroscepticism in Europe, the new U.S. government and FED’s policies incertitude in the U.S., and mixed signs for growth globally. Investors are in a quandary regarding their allocations amid the current uncertainty, and are scrutinizing investment opportunities that will allow them to navigate profitably during the new era. Risk and uncertainty are two coherent terms, but different, while investors are keen on identifying the key risks in their investments. The recent spike in the number strategies (both active and passive) seeking ‘alternative risk premium’ highlights the importance of identifying risk factors.
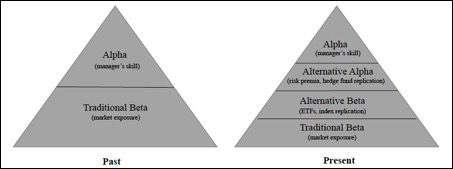
Figure 1. Evolution of alpha and beta, Source: Stone Mountain Capital Research
Figure 1 illustrates the evolution of the approach to alpha and beta as new alternative strategies and products appear. We observe alternative ways to capture beta and alpha, which is depicted in the right side of Figure 1 and we consider risk premia and hedge fund replication strategies as alternative alpha despite their systematic nature. The difference between alternative alpha and alternative beta lies in the underlying factor exposure and market directionality. There is a plethora of factors, which vary across asset classes (equities, bonds, credit, rates and commodities) and strategies. These factors are distinguished between alternative and traditional long only focusing on liquidity, volatility, style, size and other parameters with a variety of academic work around them. Most popular and widely used are the factors that were introduced by Fama and French (market, size and value) and momentum, which was introduced by Carhart. Fung and Hsieh (RFS, 2001) attempt to capture the risk of hedge fund portfolios by using a set of factors including trend following (bond, currency, commodity), equity oriented (equity market and size spread), bond oriented (bond market, credit spread) and finally emerging market risk factors. Value, carry (bonds, credit, major currency, emerging market currency) and momentum could be applied across asset classes, while style is an idiosyncratic factor for different strategies (l/s equity, equity market neutral, l/s credit, credit market neutral, relative value, macro, systematic CTA and event-driven). Figure 2 details traditional risk premia for rates (government bonds), corporate bonds, and public and private equity.
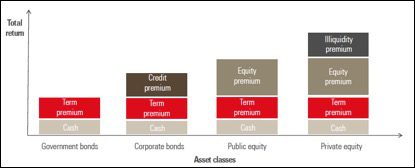
Figure 2. An Overview of Traditional Risk Premia, Source: Unigestion (for illustrative purposes only)
This perspective is neither an attempt to classify and determine the risk premium factors nor to analyse hedge fund replication techniques, but to examine volatility effects in traditional and alternative portfolios. Volatility is a statistical measure for the dispersion of an asset’s value or performance when applied to returns. It quantifies the level of uncertainty in the size of the value’s change; consequently, it measures up to a certain extent the risk of the asset. There is a distinction in the types of volatility with the two main being historical and implied volatility and academic studies evidence that implied volatility has been historically higher than historic volatility. The new status quo of the financial markets and the new socioeconomic reality makes the use of implied volatility more relevant according to this perspective as historical volatility can be misleading. The Chicago Board Options Exchange (CBOE) designed VIX, known as fear gauge, an index measuring the implied volatility of 30 calendar days S&P options. As starting point, we take the close end month prices for the new VIX from CBOE for the period between February 1993 and December 2016 and then compute its natural logarithmic returns. We evidence a leptokurtic distribution with positive skewness meaning that there is a higher probability of winning and higher probability of extreme values. The volatility benchmark for Europe is VSTOXX from EUREX, measuring the 30-day implied volatility of the EURO STOXX 50, and we follow the same process as for VIX and can evidence similar statistical features, as both have leptokurtic distributions with positive skewness. Volatility is becoming an important factor or even asset class and there is already demand for volatility related products to manage risks better and profitably. VIX and VSTOXX exhibited a slightly negative correlation and we attempt to examine this correlation with factors and other major indices.
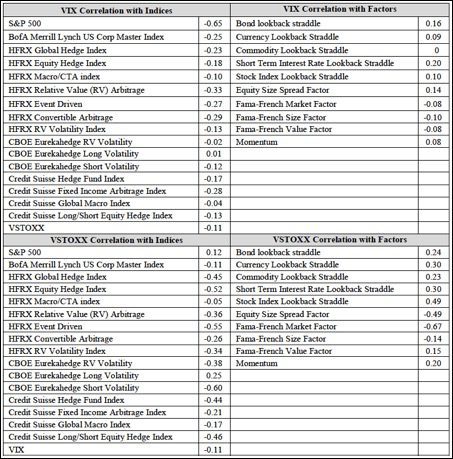
Table 1. Correlation VIX with major Indices and Factors, Source: HFR, CBOE, Credit Suisse, Fama and French, Fung and Hsieh, Stone Mountain Capital Research
Data for factors can be found in: https://faculty.fuqua.duke.edu/~dah7/HFRFData.html, http://mba.tuck.dartmouth.edu/pages/faculty/ken.french/data_library.html
The majority of indices are negatively correlated with VIX, with S&P 500 being the only significantly negative correlated with VIX. VIX has very little correlation with traditional and alternative factors. The correlation table for VIX exhibits a very interesting statistic; the lowest correlation is between VIX and strategies that trade VIX, which may suggest a unique approach of ‘volatility hedge funds’ to volatility. Another interesting fact is the low correlation between volatility in U.S. Equities and European equities. VSTOXX compared to VIX appears to have stronger (either positive or negative) correlation with most hedge fund and volatility indices and weaker with traditional indices. Robeco (2016) finds, that hedge funds bet against the low volatility anomaly, and this perspective will try to investigate the effect of volatility hedge funds in different portfolios. We consider HFRX RV Volatility and CBOE Eurekahedge RV Volatility indices as a proxy for strategies that trade volatility as an asset class, and then CBOE Eurekahedge Long Volatility and CBOE Eurekahedge Short Volatility indices as proxies to examine strategies that take either long or short position on volatility.
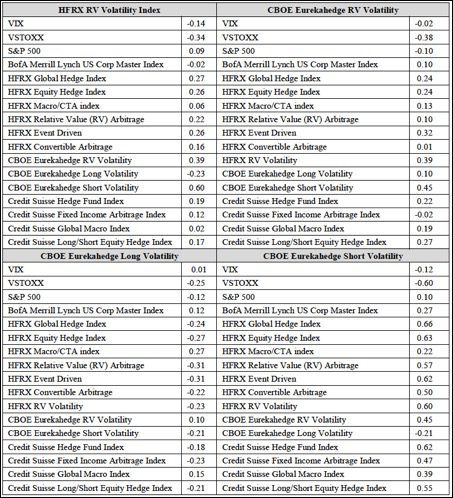
Table 2. Correlation of volatility strategies with major Indices, Source: HFR, CBOE, Credit Suisse, Stone Mountain Capital Research
HFRX volatility strategies have strong positive correlation with CBOE Eurekahedge Short Volatility strategies and are slightly negatively correlated to VIX, VSTOXX, corporate bonds and long volatility strategies, while CBOE Eurekahedge RV Volatility is slightly negatively correlated with VIX, VSTOXX, S&P 500 and Credit Suisse Fixed Income Arbitrage Index. Both are considered uncorrelated with major traditional and hedge fund indices, which suggests a good diversification source for long only equities and fixed income portfolios. As we proceed with our analysis to the long and short component of volatility trading, we observe a strong positive relationship between short volatility strategies and other hedge fund strategies across asset classes, while they are strongly negatively correlated to European stock volatility. On the other side, long volatility strategies have mainly negative relationships with the other hedge fund strategies apart from macro related strategies. As next step, we create ten artificial portfolios from January 2005 to December 2016 that include equity, fixed income, hedge funds, and volatility strategies represented by S&P 500, BofA Merrill Lynch US Corp Master Total Return Index, HFRX Global Hedge Fund Index, HFRX Equity Hedge, CBOE Eurekahedge RV Volatility, CBOE Eurekahedge Long Volatility, CBOE Eurekahedge Short Volatility and VIX respectively. The portfolios are summarized in Table 3 below.
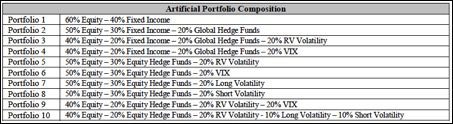
Table 3. Artificial Portfolios Composition for the period of January 2005 – December 2016, Stone Mountain Capital Research
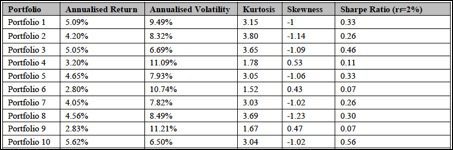
Table 4. Artificial Portfolios First Four Moments for the period of January 2005 – December 2016, Stone Mountain Capital Research
Table 4 summarises key statistics for the ten artificial portfolios and we attempt to analyse the effect of adding hedge funds and volatility strategies in a traditional portfolio. The most interesting point is, that the addition of VIX to a portfolio increases the overall risk as measured by volatility. Furthermore, including VIX in a portfolio provides us with some useful conclusions regarding skewness and kurtosis. VIX improves the skewness radically, as the portfolios that include VIX exhibit positive skewness, which is highly desirable. On the other side, VIX attenuates the kurtosis of a portfolio, which in theory reduces the riskiness of the portfolio, but it contradicts the outcome of the effect on volatility. Moreover, portfolios with VIX produced the lowest Sharpe ratio. An important point to note is that VIX is not tradeable and in that sense this perspective refers to hypothetical results or to products that attempt to mimic VIX, like VIX futures and VIX exchange traded notes (ETNs). Adding relative value volatility strategies to a portfolio with hedge funds and traditional investments produced higher returns and less risk with slightly higher skewness and lower kurtosis, while it produced the second highest Sharpe ratio (portfolio 3). Then we proceeded and created purely equity focused portfolio combining traditional and alternative equity with volatility strategies. Portfolios 5-8 have a core composition of 50% traditional equity, 30% equity hedge funds and the remaining 20% is attributed to the volatility spectrum. The best performing, in terms of Sharpe ratio, is the portfolio, that includes relative value volatility strategies followed by short volatility and long volatility strategies. Finally, the best performing portfolio was portfolio 10, which is an equity focused portfolio with traditional equity, equity hedge funds and the three hedge fund volatility strategies. Overall, the inclusion of volatility strategies suggests the enhancement of performance for portfolios and volatility is not just a factor, but an asset class that is worthy exploring further for investors. Eurekahedge has recently created a set of new volatility hedge fund benchmarks underpinning the risen investor interest in volatility as alternative risk premium across asset classes and tradable asset class itself. Stone Mountain Capital is mandated from hedge fund managers pursuing different long, short, l/s and directional volatility strategies.
This perspective is neither an offer to sell nor a solicitation of an offer to buy an interest in any investment or advisory service by Stone Mountain Capital LTD.
- Explore Categories
- Corporate
- Funds
- People
- Regulatory
- Technology