Despite a tight labor market, wage and productivity growth remain low in the US. Wage growth stood at just 2.5% in July 2017, on par with post-Recession performance. Labor productivity growth averaged only 1.1% between 2007 and 2016. Between 1995 and 2007, by contrast, the average growth rate was 2.5%. Although cyclical factors may be partially to blame, there are several key structural features of the US economy contributing to diminished growth. Wage and productivity growth are being held back by persistently low inflation expectations, workforce demographics, and the shift in the payrolls distribution in the economy in favor of lower-wage sectors.
The Federal Open Markets Committee’s (FOMC) minutes of the July 25-26 meeting underscored its concern with wage and productivity data. The committee noted there was “tightness in the labor market, but. . . little evidence of wage pressures.” Some FOMC participants speculated if the “hiring of less experienced workers at lower wages” was a contributing factor. Others pointed out that low wage growth is in line with what productivity growth and the inflation rate (both sluggish, of late) would suggest. Indeed, the Federal Reserve’s concern about wage and productivity growth is likely to be a major factorin the debate over the timing and termination point of future rate rises – arguing for fewer and further apart hikes, and perhaps a termination point around the range of 1.50% to 1.75% for federal funds.
The FOMC’s unease with wage and productivity growth is hardly unique. Analysts and academics alike have advanced a spate of theories to explain the low numbers. Favorite suspects include lingering weakness in the labor market not captured in the headline unemployment number; downward nominal wage rigidity; output mismeasurement, particularly in services and tech-related sectors; a drought of productivity-boosting, technological advancements; a slowdown in capital growth; and the deteriorating quality of public education.
Although many of these factors may play a role in limiting wage and productivity growth, the US economy has also undergone several structural changes: 1) persistently low inflation expectations, 2) shifts in workforce demographics, as Baby Boomers exit and Millennials enter the workforce, and 3) the changing distribution of payrolls by industry favoring lower-pay sectors.
Our view is that structural changes are largely responsible for the modest growth in wages and productivity in the economic expansion after the Great Recession of 2008-2009. By implication, there is nothing the Federal Reserve can do with monetary policy to address structural changes related to demographics and shifts in the distribution of jobs among sectors.
Low inflation expectations
Because inflation (along with productivity growth) is a key component in wage growth, inflation expectations play a role in determining wage growth. As measured by the University of Michigan survey, inflation expectations have declined sharply from a peak of over 10% in 1980.
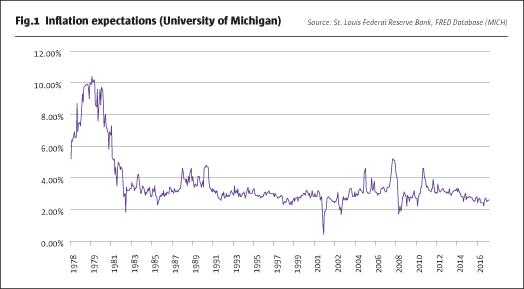
Inflation expectations did rise at the very beginning of the economic recovery from the Great Recession, reaching 4.6% in March of 2011 – when a consensus anticipated a quick recovery. These hopes proved to be misplaced; the economy’s real GDP grew at a steady but modest pace of 2%. Inflationary pressures have been largely absent. As early views were gradually revised, inflation expectations dropped, coming in at 2.6% in July; still above the recent sub-2% trend in inflation. The post-2011 decline in inflation expectations may have held back subsequent wage growth. Employees and employers increasingly expected lower inflation – and with it, lower raises.
Demographic shifts
As inflation expectations declined, the composition of the US workforce also underwent significant changes. The US has three major working-age generations: Baby Boomers (born post-WWII through 1965, per Pew Research Center), Generation X (1965-1980), and Millennials (1981-1997). Boomers comprise an unusually large generation, with 76 million born between 1946 and 1965, compared to 55 million for Generation Xers and 65 million for Millennials.
The Boomers’ ranks, however, have begun to fall in recent years as mortality outpaces immigration. In 2015, Pew found that Millennials had surpassed Boomers to become the largest generation, with 75.4 million Millennials, 74.9 million Boomers, and 66 million Generation Xers. This generational distribution is changing the workforce. In the past few years, the large and aging Boomer cohort saw an increased number of retirements. Millennials, on the other hand, are still entering the workforce.
The ramifications for productivity and wage growth are significant. Boomers are more likely to be high-wage, high-experience workers. Their retirement from the workforce is a critical element for wage and productivity growth. The new entrants to the workforce, Millennials, are less experienced and earn lower wages. Their entrance to the workforce has the same effect as the Boomers’ exit – wage and productivity growth are dragged down.
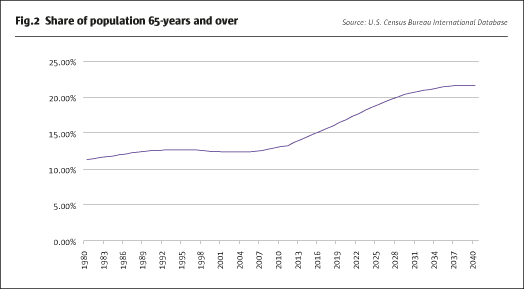
Graphing the share of the US population over the age of 65 reveals a post-recession retirement hike. There is a clear and dramatic spike in the 65-years and over population, picking up after 2007, as the Baby Boomer retirement era commenced. The retirement-age population increased from 12.6% of the total population in 2007 to 15.6% today, and will continue to increase until the 2030s.
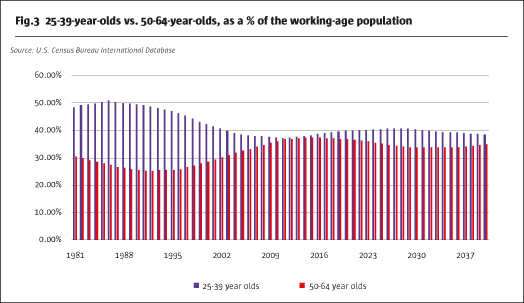
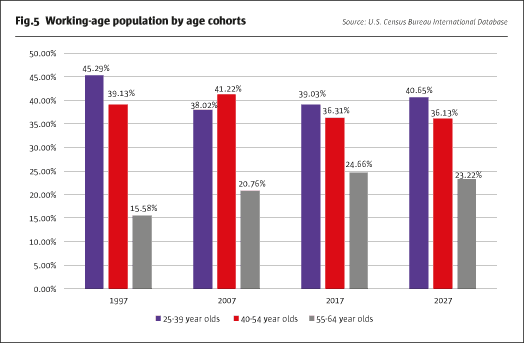
The generational composition of the working-age population itself can also be measured (the working-age population is defined here as 25-64-years). The oldest segment of the workforce (50-64-year-olds) increased as a share of the working-age population between 1992 and 2015, rising from 25.19% to 37.45% before declining slightly to 37.2% in 2017 as older workers retired. The youngest segment of the workforce (25-39-year-olds) increased to 39% from a low of 37.16% in 2011. As a share of the workforce, younger Millennials have come to the fore, while older Boomers are gradually retiring out.
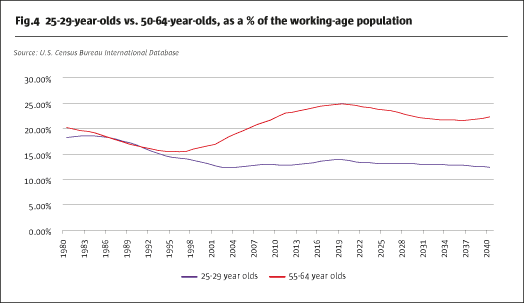
The 25-29-year-old segment of the population, which provides a snapshot of very new workers, increased as well, rising to 13.72% in 2017 from 12.33% in 2003, and reversing a decline that spanned the mid-1980s through early 2000s. The 55-64-year-old cohort, which provides a metric for older, near-retirement workers, has leveled out at around 24.66%, and will soon decline.
The result of these demographic shifts is a workforce adding an increasing number of young workers, while shedding an increasing number of older ones. This generational change is dampening wage and productivity growth.
Sector shifts
The US is also undergoing a change in payrolls distributions. Much has been made of the transition toward a service-based economy – services account for 70% of total nonfarm payrolls today, compared to 55% in 1980. Manufacturing, meanwhile, has fallen from 20% of nonfarm payrolls in 1980 to 8% today.
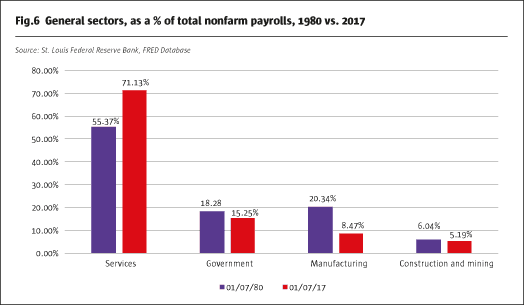
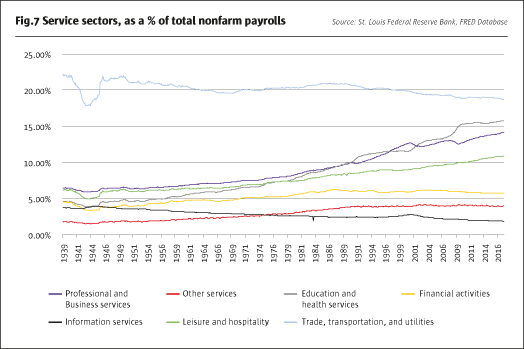
Three service sectors benefited tremendously from the shift toward a service-based economy: education and health services, professional and business services, and leisure and hospitality. These sectors have grown rapidly as a share of total nonfarm payrolls, representing 41% of total nonfarm payrolls in 2017, up from 37% before the recession, and 24% in 1980. The largest service sector (trade, transportation, and utilities) lost some ground as a share of payrolls, while still adding a considerable number of jobs; government, on the other hand, fell precipitously following the Great Recession, as state and local authorities aggressively shed jobs in the 2010-2013 period.
These shifts are significant in today’s tight labor market. The US has added over a million jobs so far this year, with 2 million added in 2016. In total, nearly 15.6 million jobs have been added to total nonfarm payrolls since the end of the recession in June of 2009. If the allocation of payrolls is shifting as the labor market continues to add jobs at a breakneck pace, wage and productivity growth may be affected.
The post-recession payrolls expansion has benefited mostly lower-paying private service sectors. These include leisure and hospitality; trade, transportation, and utilities; and education and health services. Only one high-paying sector has seen considerable expansion – professional and business services. Low-pay growth has slightly outpaced high-pay growth; but the growth in both high- and low-paying sectors has surpassed that of mid-paying sectors. These expansion trends may also be contributing to sluggish wage and productivity growth.
The government sector is excluded here because hourly earnings data is not available. However, the government sector contracted considerably during the recovery (losing 850,000 jobs in the early days of the recovery, and recovering only partially). This sector is usually higher-paying with excellent benefits; its contraction had a negative impact on wage and productivity growth.
In total, the three lowest-paying private sectors (leisure and hospitality; trade, transportation and utilities; and other services) contributed 37% of nonfarm jobs growth in the post-recession period. These jobs all pay below the “all employees” average; their expansion detracts from wage growth. With education and health services added (the fourth lowest pay sector, at around average pay), the four lowest paying sectors account for 60% of post-recession jobs growth.
The three highest paying sectors (financial activities, mining and logging, and information services) added only 3.7% of post-recession jobs growth. With the fourth-highest pay sector (professional and business services), that measure soars to 31%. Expansion in these sectors, which all pay above average, has contributed to wage growth.
The two mid-paying sectors (manufacturing and construction, both of which are at above-average pay) added only 10% of the post-recession jobs expansion.
This post-recession expansion paints a picture of an increasingly polarized jobs market, with jobs going largely to low-paying sectors and high-paying sectors. Expansion within low-paying sectors slightly outpaces high-paying sectors; both, however, have far outstripped mid-paying sectors.
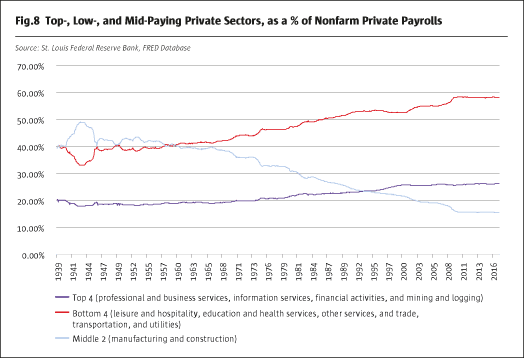
Polarization by pay can be observed by graphing the share of private nonfarm payrolls allocated to the top-four, bottom-four, and mid-two paying sectors. Growth in the lowest four-pay sectors has outpaced the top four. The gap between the two stands at 27%, up from 21% in 1980 and 25% at the start of the recession.
Mid-pay sectors, meanwhile, have plummeted, stabilizing at around 15.6% after the recession. This pattern of payrolls expansion may pose an obstacle to strong wage and productivity growth.
Implications for policy
The US economy’s structural changes indicate that lower wage and productivity growth could linger for some time. First, falling inflation expectations may inform workplace decisions about raises, until observed inflation rises above 2% and accelerates for a few quarters. A material rise in measured inflation is not included in our 2017-2018 economic outlook. Second, the dual effects of retiring Boomers and new Millennial workers will leave the US with a slightly younger, slightly less experienced, and modestly lower-paid workforce. This trend will reverse – after Baby Boomers retire in the 2020-2025 period. Third, the reallocation of payrolls toward service sectors on either end of the pay spectrum is also a limiting factor, as a large share of new jobs are added to very low-paying sectors (such as leisure and hospitality). While we see this trend stabilizing, we do not see a reversal in either the short or long-term.
In terms of policy implications, the Federal Reserve is likely to remain exceedingly cautious in raising rates. And, with persistently low wage and productivity growth, even if for structural reasons, the terminal federal funds rate for this rate cycle may be in the 1.50% to 1.75% range. Fiscal policy is a different story. Infrastructure spending and investment in education could make a difference over time.
Unfortunately, the outlook for increased federal government spending on infrastructure has dimmed considerably over the summer, and the Republican-controlled White House, Senate, and House of Representatives seem more intent on cutting education support than adding to it. So, it looks like wage and productivity growth must await the retirement of the Boomer generation before increasing.
All examples in this report are hypothetical interpretations of situations and are used for explanation purposes only. The views in this report reflect solely those of the authors and not necessarily those of CME Group or its affiliated institutions. This report and the information herein should not be considered investment advice or the results of actual market experience.
- Explore Categories
- Commentary
- Event
- Manager Writes
- Opinion
- Profile
- Research
- Sponsored Statement
- Technical
Commentary
Issue 126
Sluggish Wage and Productivity Growth
Structural changes are to blame
NATALIE DENBY AND BLU PUTNAM, INTELLIGENCE & ANALYTICS, CME GROUP
Originally published in the September 2017 issue