In recent years there has been a significant increase in the availability of managed futures products through alternative structures such as 40 Act mutual funds, UCITS, and even ETFs. The largest growth has been seen in the United States, which has witnessed an approximately five-fold increase in assets over the last five years alone, with a similar increase in the number of products. This snapshot describes the growth in the space and details the types of CTA strategies that are available in a mutual fund format. It also provides an evaluation of the performance of these new products in comparison to our newly created SG CTA Mutual Fund Index.
Growth of CTA mutual funds
CTAs are one of the most liquid alternative investment strategies due to the liquidity of the underlying markets that they trade, which renders them as ideal candidates to be made available in the US 1940 Act mutual fund format. They also provide valuable diversification benefits to a traditional portfolio, and these, among other factors, help explain the significant growth seen in mutual funds employing managed futures strategies.
Assets under management (AUM) have increased approximately five-fold in the last five years to reach $26 billion at the end of March 2016 (see Fig.1, top). This significant growth has been an important component of the overall CTA industry development, as managed futures mutual funds now account for more than 7% of the total CTA AUM. Furthermore, the significant growth over the last five years by the CTA mutual funds compares to a 22% growth by the CTA industry overall during the same period.
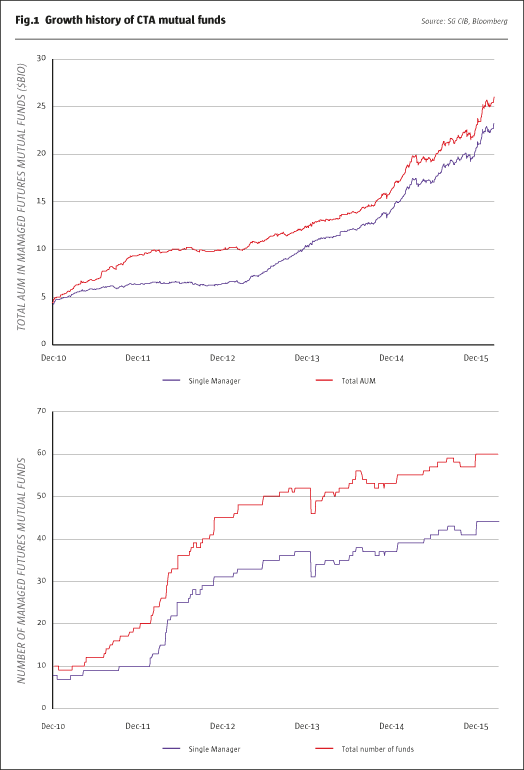
Not only have the AUM in these structures increased, but there has been a similar growth in the number of the available products, which increased roughly six-fold to reach 60 (Fig.1, bottom). Fig.1 also shows that multi-manager products were the early adopters of this structure; however, since 2012 single-manager products have dominated the asset growth.
Whilst this growth has been impressive, it has been fairly concentrated among a small number of managers. The five largest CTA mutual funds account for 70% of the AUM, while the next five represent approximately 13% of assets. It is important to point out that CTA managers also undertake sub-advisory mandates in multi-strategy, multi-manager mutual fund products, which were not included for the purposes of this analysis.
Given the increased significance of the CTA mutual fund industry, it is worth mentioning a recent SEC proposal aimed at limiting the amount of leverage, including derivatives, deployed by registered investment companies. Among other things, the proposed regulation seeks to impose hard limits on the amounts of gross notional exposures that can be utilized by mutual funds, which could call for alterations in the strategies deployed by a variety of managers, including CTA mutual funds. While it is too early to forecast the impact of the final rules on the CTA mutual fund space, the initial proposal alerted the industry participants to provide feedback to the initial SEC proposal, suggesting, among other things, alternative measures of risk in CTA mutual funds.
Gathering the data
In order to evaluate the CTA mutual fund space we needed to construct a database of eligible managers, and to do this we utilized multiple sources of information, including our own NERD database in addition to Bloomberg and Morningstar.
In line with the definition of “CTA” utilized in our CTA indices, we identified all the mutual funds that express their investment strategies via diversified futures and/or currencies trading, regardless of how they were classified by the external source of information. We also excluded any mutual funds that were passively managed, pursued long- or short-biased investment strategies, engaged in volatility selling or replication strategies, as well as funds with large exposures to instruments other than futures/currencies.
Our database includes both live and liquidated CTA mutual funds, and for our historical analysis, both these datasets have been included, which can be evidenced by temporary declines in the number of funds in Fig.1 (bottom) due to fund liquidations.
In our analysis of fee structures and the number of investment advisors, we reviewed the individual mutual fund prospectuses or contacted the investment advisors and underlying managers of the mutual funds. In identifying the detailed types of the strategies, we used our industry knowledge and relationships with the managers advising the mutual funds to perform surveys and strategy reviews.
Classification framework
In our recent snapshot titled ‘The Life Outside of Trend,’ we provided a detailed classification framework for CTA strategies with respect to their investment approaches, trading timeframes, diversification across sectors and return drivers. When we consider CTA mutual funds, we need to extend this framework by adding three additional items with respect to how CTA mutual funds are constructed (see Fig.2).
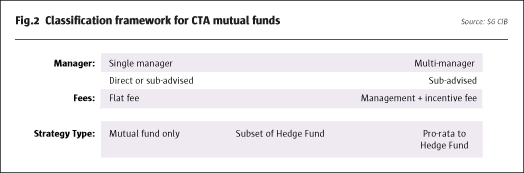
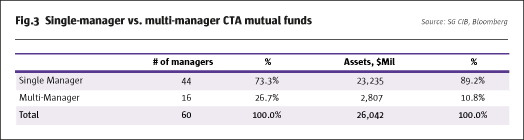
The first of these additional items is whether the mutual fund is a single- or a multi-manager product. Further, the single-manager mutual funds can be set up directly by the firm managing the investment strategy or, as is often the case, by a distribution partner whereby the investment strategy is managed by a sub-advisor. In a multi-manager setting, investment strategies are managed by several sub-advisors. Fig.3 provides the breakdown by number of managers and fund assets for both the single-manager and multi-manager CTA mutual funds. Whilst single-manager products represent the majority of the assets (accounting for 89% of the total $26 billion in assets), multi-manager products actually represent 27% of the number of products available.
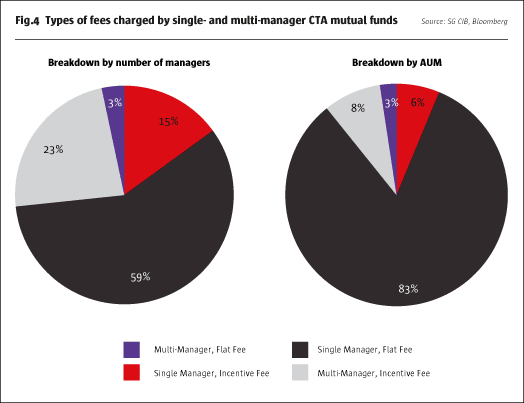
The second additional item relates to the fee structure and whether or not any form of incentive fee is included. Fig.4 shows the types of fees charged by both single- and multi-manager CTA mutual funds. One key observation is that across all products approximately 86% of assets are managed within flat-fee products. Most of the single-manager funds charge a flat fee (93% by assets and 80% by count of managers), while most of the multi-manger products have both a management fee and an incentive fee.
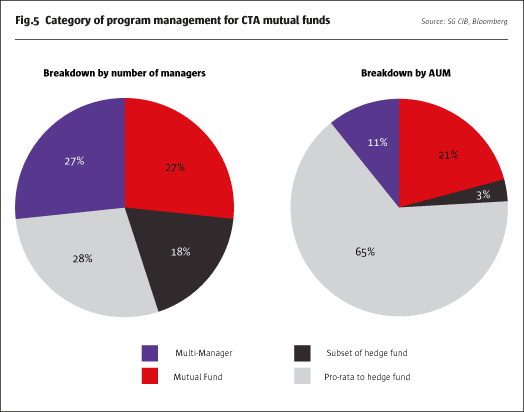
The final additional item covers one of the key questions investors often ask, which is whether an investment program managed by a CTA mutual fund is a replica of a flagship hedge fund product or a version of the strategy with some alterations. In attempting to answer this question, we classified the 44 single-manger CTA mutual funds into three groups:
- Pro-rata to hedge fund, i.e. the same investment program as the hedge fund version, managed at the same or a different volatility level.
- Subset of hedge fund. These programs originate from a flagship hedge fund strategy and are subject to such modifications as carve-out of sub-strategies, removal of certain markets traded, etc.
- Mutual fund. This category includes managers where the mutual fund version is their flagship investment program.
As shown in Fig.5, by number of managers (left panel), the categories of programs are fairly well distributed across the three above-mentioned groups. The picture is quite different, however, if one looks at the assets managed (right panel), with 65% of the assets being in single-manager CTA mutual funds run pro-rata to the hedge fund version of the investment program. Managers who only offer the mutual fund version of the program came in second with 21%, followed by only 3% of assets being in the "Subset of hedge fund" category. It is worth mentioning that with several exceptions, the multi-manager CTA mutual funds not detailed in this analysis often combine programs run pro-rata to hedge fund versions.
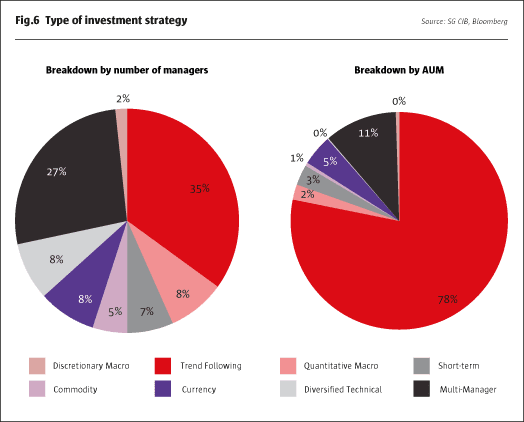
In our snapshot, ‘The Life Outside of Trend,’ we created a classification of strategies run by CTA managers to provide a more granular view with respect to the types of investment drivers behind the programs. Particularly, we identify if a strategy pursues primarily trend-following types of models or non-trend-following, including quantitative macro, currency, short-term, discretionary macro or diversified technical strategies. In Fig.6 we used the same classification methodology to break down strategy types across single-manager CTA mutual funds, with multi-manager products remaining a separate category. When looking at the number of managers (left panel), there is a good degree of diversity between the types of strategies, with 35% of all managers pursuing trend-following and 38% non-trend-following single-manager strategies. This strategy split again looks very different for assets under management (right panel), with 78% of assets in trend-following products and only 11% in non-trend-following single-manager products, led by currency strategies at 5% of assets.
A benchmark for CTA Mutual Funds
As demonstrated in this paper, CTA mutual funds have not only become a considerable part of the CTA industry, but also these products are often different from the traditional hedge fund CTAs in a variety of ways, including product design, fees charged and dominance of certain strategy types. These differences were among the reasons to consider adding another benchmark index to the suite of indices we manage. On January 1, 2016, we launched the SG CTA Mutual Fund Index, a daily index comprised of the largest 10 single-manager CTA mutual funds that are open to new investment and will provide us with daily data from our eligible universe detailed above.
Guided by our experience of managing CTA industry benchmark indices since 2000, we used the same methodology of index construction for the CTA Mutual Fund Index as for our flagship daily indices. In particular, for the new CTA Mutual Fund index, we choose the 10 largest managers every year and calculate daily the equal-weighted performance of the index. It is worth noting that our flagship SG CTA Index has 20 constituents. However, for the relatively young CTA mutual fund industry, we stopped at 10 managers as we showed above that these represent 83% of the total assets under management, and by going further we would be adding managers with fairly small AUMs. For 2016, the 10th largest fund had slightly less than $100 million (vs. the 20th smallest in our CTA Index of $0.98 billion). If the number of large CTA mutual fund managers increases in the future, we may re-evaluate the number of constituents.
With live performance being tracked since the beginning of 2016, we also backfilled the returns to January 1, 2013, using the same methodology every year, including our live and liquidated fund datasets, rebalancing and reconstituting on January 1.
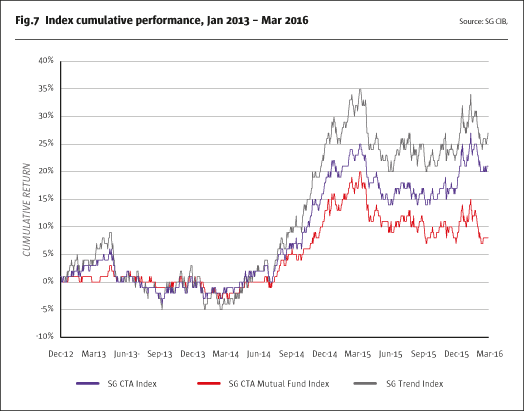
In Fig.7 and Fig.8 we provide a comparison of the CTA Mutual Fund Index performance to our SG CTA Index and SG Trend Index. As can be seen from the summary statistics, the volatility of the SG CTA Mutual Fund Index is similar to that of the SG CTA Index but is below that of the SG Trend Index. While the SG CTA Mutual Fund Index has recently underperformed the SG CTA Index and the SG Trend Index, one key observation is that the SG CTA Mutual Fund Index has a high correlation to the other two benchmarks, which demonstrates that constituents of the index can provide exposures representative of the broader CTA industry. The cumulative performance in Fig.7 shows that the path of performance for the SG CTA Mutual Fund Index is similar to those of the SG CTA Index and SG Trend Index, with periods of both superior and inferior performance driven, in part, by the generally lower volatility of the underlying mutual fund constituents versus the hedge fund peers.
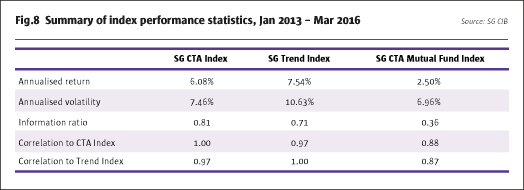
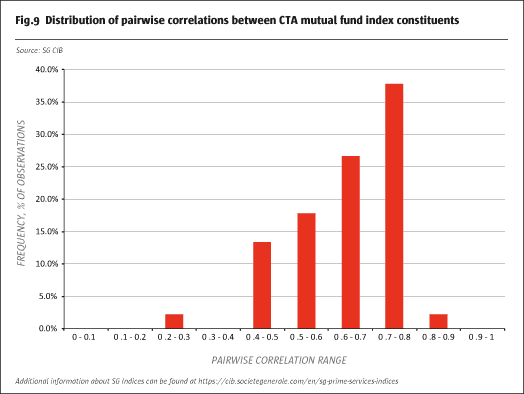
Earlier, we demonstrated that trend-following strategies dominate the CTA mutual fund space and that the correlation of the SG CTA Mutual Fund Index to the SG Trend Index is at 0.87. As a next step, we wanted to examine the level of correlation between individual SG Mutual Fund Index constituents. In Fig.9, we look at the distribution of 45 pairwise correlations between the 10 current constituents in the CTA Mutual Fund Index. Two-thirds of the constituents have a correlation of 0.6 or higher, with only one observation below 0.4 and the average pairwise correlation of 0.66. The relatively high number of observations with elevated pairwise correlations is not surprising given that nine out of the 10 Index constituents are trend-following strategies.
Conclusion
Increasing five-fold in the last five years to reach $26 billion, the CTA mutual fund space has become an important part of liquid alternatives and the CTA industry overall. Several key players emerged in the space, with the five largest CTA mutual funds accounting for approximately 70% of the assets under management.
Given the significant growth of the CTA mutual funds, we mentioned a recent SEC proposal aimed at limiting the amount of leverage, including derivatives, in registered investment companies. With many industry participants providing feedback to the initial proposal, attention is focused on what the final SEC ruling may spell for existing mutual funds strategies.
As part of our analysis, we have constructed a dataset isolating actively managed CTA strategies. We observed a significant level of variability of how products are structured, managed and priced, which called for the creation of a classification framework. As a next step, we did a deeper dive into each of the differentiating factors within the framework.
First, we provided a breakdown by number of managers and fund assets for both the single-manager and multi-manager CTA mutual funds. With approximately 89% of the total assets ($23.2 billion of the total $26 billion), single-manager products are prevalent in the space. With almost one-third of the total number of managers, multi-managers account for only 11% of total assets.
Second, we looked at the fees charged by both single- and multi-manager CTA mutual funds. Approximately 86% of aggregate assets are managed within flat-fee products. Most of the single-manager funds charge a flat fee (93% by assets and 80% by count of managers), while most of the multi-manger products have both a management and an incentive fee component.
Third, we segregated single-manager funds into three groups depending upon how their mutual fund products are related to other strategies managed by the same investment adviser. The key observation was that 65% of the assets in CTA mutual funds are run pro-rata to the hedge fund version of the investment program, followed by 21% where only the mutual fund version of the program is offered to investors and only 3% of assets being classified as a "Subset of hedge fund" category.
To complete the analysis pursuant to the classification framework, we looked at the types of investment strategies run within the CTA mutual fund vehicles. While the breakdown by number of managers showed a solid level of diversity between the types of strategies,the strategy split looks very different for assets under management, with 78% of assets in single-manager, trend-following products and only 11% in non-trend-following, single-manager products.
In concluding the analysis, we presented a recently created benchmark for evaluating managed futures mutual funds – the SG CTA Mutual Fund Index launched on January 1, 2016. One of the important observations was that the CTA Mutual Fund Index has a high correlation to the industry benchmarks – SG CTA Index and SG Trend Index – which demonstrates that constituents of the index can provide exposures representative of the broader CTA industry. Lastly, we provided a snapshot of pairwise correlation distribution for the current CTA Mutual Fund Index constituents. Two-thirds of the constituents have a correlation of 0.6 or higher, with the average pairwise correlation of 0.66, which is not surprising given that nine out of the 10 Index constituents are trend-following strategies.
- Explore Categories
- Commentary
- Event
- Manager Writes
- Opinion
- Profile
- Research
- Sponsored Statement
- Technical