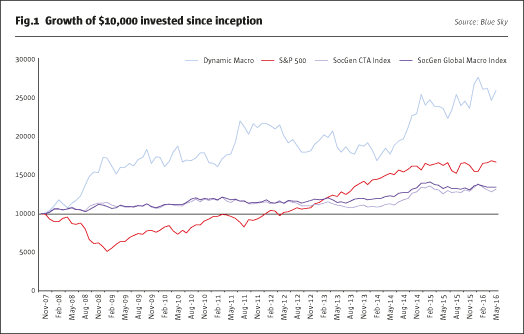
Blue Sky’s Dynamic Macro (Blue Sky) portfolio is expanding Australia’s footprint on the CTA world map. As of March 2016, the strategy was among the top performing 20 CTAs in the BarclayHedge database, based on its compound annual return of 10.2% for the previous five years. This is particularly significant as BarclayHedge – which Sol Waksman founded 31 years ago – is renowned for the breadth of its CTA coverage, and acts as calculation agent for the Societe Generale Prime Services CTA performance indices. Blue Sky returns since inception in 2007, in AUD, are shown in Fig.1. The annualised returns of 12.2% are towards the top end of the target of RBA (Reserve Bank of Australia) cash rates +6-10%; the volatility target of 16% implies that anticipated returns work out at a Sharpe ratio of between 0.4 and 0.6; in fact the Sharpe has been 0.67 since inception.
Diversification
For CTA allocators, the pattern of returns can matter as much, or more, than the level of returns. CTAs are often viewed as portfolio diversifiers whereby their impact on a portfolio Sharpe ratio is more relevant than individual CTAs’ standalone Sharpe ratios. “We are a classic diversifier and a true hedge fund,” states Neil Power, Head of Blue Sky Hedge Funds. Blue Sky has delivered the ‘crisis alpha’ that is so sought after by CTA investors with strong returns in 2008 and 2011, as well as 2014 and early 2016. “Blue Sky has been negatively correlated to equities, has performed as expected during every equity crisis and this is by design,” underscores Power.
Many CTAs have also produced profits during a high proportion of equity bear markets. Blue Sky offers an additional benefit for those investors already conversant with the general benefits of CTAs. Though the Blue Sky strategy did particularly well in the strongest years for most trend following CTAs (2008 and 2014), Blue Sky has also often performed well during tepid periods of CTA performance. As well as diversifying conventional asset class exposures, Blue Sky is lowly correlated with what Power terms ‘brand name CTAs’.
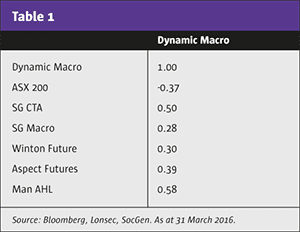
Blue Sky has shown correlations of between 0.3 and 0.6 to CTA indices and leading CTAs. As such it offers extra diversification benefits as part of a basket of CTAs added to pools of conventional assets, or hedge funds, or for specialist portfolios comprised purely of CTA and/or macro strategies. We know of a number of funds of funds focusing on tactical trading strategies that are seeking differentiated return profiles from individual holdings.
The diversification mentality permeates Blue Sky’s own portfolio construction. Some CTAs focus mainly, or entirely, on trend following. Blue Sky has three broad strategies – trend following, mean reversion and risk premium – that are uncorrelated. Under these three umbrellas there are a total of 43 sub-strategies that provide additional diversification advantages. In addition to employing some well-known alpha signals, Blue Sky has developed a suite of proprietary signals, which may add a further dimension of decorrelation.
Dynamic rebalancing vital
Rather than Strategic Asset Allocation (SAA) among asset classes, Blue Sky pursues Strategic Risk Allocation (SRA) among strategies, which tend to be less correlated than are asset classes – particularly in a post 2008 world where Quantitative Easing is widely perceived to have increased correlations between and within asset classes.
Some systematic funds maintain relatively constant weightings to sub-strategies, and will rebalance by top-slicing winners and adding to losers, mainly for the purpose of keeping similar weights and sometimes purely for risk management reasons. But keeping even or stable weightings to sleeves of uncorrelated strategies is not sufficient for Blue Sky. Indeed, for Blue Sky the process of dynamically reallocating among strategies is viewed very much as a profit centre. Power says that “95% of returns have come from the allocation overlay since it was introduced in July 2013” with the level of returns far higher than would have been attained from equal weighting.
Prior to July 2013, Blue Sky used discretion to allocate among strategies and this is partly responsible for the pullback in performance seen in 2012. Power recalls how “the strategy performed very well in the 2008 credit crisis and the 2011 European crisis but we retained a bearish bias in 2012 that was wrong.”
Power attributes the downbeat positioning to insights from behavioural finance, pointing out that “humans have cognitive biases.” Hence the process was systematised, and simulations suggest that it would have performed better in 2012.
Blue Sky has developed proprietary forecasting techniques to allocate among the three broad strategies and the 43 sub-strategies. The process, termed ‘The Quadrant dynamic risk allocation model’ starts with Blue Sky calculating its own measure of ‘historical adjusted money supply’, separate claims from credit transactions, to indicate the growth and inflation outlook for regions and countries including the US, Europe, China, Japan and the UK. As part of this routine, Blue Sky also estimates time lags between changes in the money supply and their impact on growth and inflation.
Statistical regression analysis is then used to map the regional macro landscapes onto the matrix of strategies, to anticipate which will outperform and which will underperform. “This is critical to connect the macro analysis to the underlying strategies,” emphasises Power. All 43 sub-strategies will have some allocation, however small, and a minimum variance approach is used to avoid over-concentration of risk in specific strategies or factors. Minimising exposure to the underperformers is a key objective – “if you can downsize six strategies likely to lose money, the others will often take care of themselves,” recalls Power.
Volatility regimes
One big picture perspective is how the rebalancing shifts between strategies that do well in high volatility regimes and those that do better in lower volatility climates. “We are trying to create a product providing portfolio diversification when needed, in terms of crisis alpha tail protection, but we realise this can become expensive at times,” Power explains.
Blue Sky does not want to be paying away for ‘insurance’ at times when it is unlikely to pay off. So when Blue Sky’s models are not throwing up signals conducive to the ‘long volatility’ families of strategies, the systems switch back to ‘short volatility’ strategies (though Power confirms that none of the strategies are explicitly short of volatility and nor are they selling options). Instead, strategies that tend to do better with flat or falling volatility include “risk premium, carry, commodity curve and convexity, and some trend strategies,” he notes.
Blue Sky can sometimes be contrarian when models generate strongenough signals. Blue Sky’s economic forecasting has made a good call in 2016, in expecting a greater US slowdown than was priced in. “We were not that surprised by Yellen pushing back the timeframe for rate rises as we always thought there was a very low likelihood of four rate hikes in 2016,” points out Power. In early 2016, Blue Sky’s macro models contributed towards a short position in the equity markets and were positioned to profit from curve flattening in fixed income markets. “These positions were profitable as markets re-assessed the outlook,” says Power. In fact, many CTAs had strong profits in January and February 2016, with some similar positions. Blue Sky has hung onto a greater share of its profits, partly because its dynamic rebalancing has helped to lock in profits by scaling back some winning trades. For instance, “we took some profits on the curve flatteners” recalls Power. This is region-specific rather than global, because the macro models have different forecasts for each region. Thus the models have anticipated some recovery of growth in Japan and China, which has been one signal for the system to take off short positions in the Australian and Canadian dollars – ‘commodity currencies’ that have been helped by the bounce in energy and metal prices in 2016.
If Blue Sky’s methodology for strategy rebalancing strikes us as highly distinctive, its investment universe does not seem particularly unusual for a CTA. Blue Sky trades 49 of the most liquid interest rate, FX, commodity and equity markets and Power – who has previously carried out order routing for Bloomberg – says “liquidity is very important and we monitor it closely to avoid it getting expensive.” The portfolio is rebalanced monthly so “we are not in a rush and can be patient about execution,” Power adds. Prime brokers include Societe Generale Prime Services, Morgan Stanley and Credit Suisse.
Research process
Co-portfolio managers are Dr Chris Howland, who previously worked at Bell Labs US, and Blue Sky co-founder Simon Kitson. Howland and Kitson manage most of the research and new ideas go to the Investment Oversight Risk Committee, “which has rigorous procedures ” says Power, who as MD of hedge funds, sits on the Investment Oversight Committee and the Risk Committee. Ideas could come from internal research or published academic journals. Criteria for evolving the programme – by adding, deleting or refining models – include that idea generation needs to be logical and repeatable, and is not just based on statistical patterns. New models should also be uncorrelated to the existing book. A committee process is used to approve changes, and risk management is independent of portfolio management.
Doctor of Electrical Engineering Howland – who also has responsibility for IT infrastructure at BSIS – was awarded US, EU and Japanese patents in mathematical methods and forward error correction codes, and has traded portfolios of futures. Kitson – who is also Blue Sky’s Group Economist – had previously managed as much as A$17 billion for some Australian government debt management agencies. Howland and Kitson have developed the strategy since November 2007, in a business called Investment Science that was bought by Blue Sky in April 2014. The new entity is called Blue Sky Investment Science Asset Management Pty Ltd (BSISAM).
Company background
Joining forces with Blue Sky provides access to an institutional quality organisation and infrastructure. Diversified alternative asset manager Blue Sky was founded in 2006, manages over A$2 billion, has 85 staff, with offices all over Australia, and hedge funds sitting alongside venture capital, private equity, real estate and real assets, including a presence in the US. Blue Sky floated on the Australian stock exchange in 2012. Since then the share price has more than sextupled in contrast to the lacklustre stock-market performance of many alternative asset managers over that period. The firm has a market capitalisation of around A$530 million, with significant staff shareholdings. Very few hedge fund managers are public companies, but being so does guarantee transparency and regularity of reporting at the management company level.
Blue Sky is currently regulated by Australia’s Australian Securities and Investments Commission (ASIC), which has adopted Open Protocol Enabling Risk Aggregation (formerly known as OPERA) for regulatory risk reporting. Before Blue Sky begins marketing its offshore vehicle, it expects to register with the CFTC and NFA. Power has many years’ experience of US regulatory oversight from his previous employers.
Blue Sky has Australian fund structures, including one listed closed end fund, offering both direct exposure to the Blue Sky strategy, and indirect exposure via multi-strategy vehicles sub-allocating to Blue Sky alongside several other Blue Sky strategies. However, Power has found that Australian allocators are often well behind those in other regions when it comes to alternatives, including hedge funds, hence Blue Sky is spreading its wings outside Australia. Blue Sky is currently accessible via managed accounts, with a minimum of A$10 million (or the equivalent in other currencies with hedging back to various base currencies on offer) needed to run the strategy in line with the model signals and pari passu with the fund. A Cayman vehicle is being readied to reach out to a broader audience of institutional investors. Power, who attends conferences such as MFA Miami, does not think a UCITS is a priority as he finds Cayman funds are popular in the US and Asia. Power estimates capacity for the strategy could be at least US$1 billion.
If Australian funds might seem off the beaten track for some allocators, they have always been on The Hedge Fund Journal’s radar. AIMA held an Australian hedge fund forum in Sydney in September 2015, which was covered in a previous issue (October 2015). According to AIMA, Australian hedge fund assets now total over A$100 billion. THFJ profiled Melbourne-based eclectic macro fund AE Capital in 2015, and short term CTA, Kaiser Trading Group, is also in the Melbourne area. Another shorter term CTA is Power’s former employer, Boronia Capital, which is based near Sydney. Altogether many allocators tell us that these – and a number of discretionary Australian managers including Bronte Capital’s John Hempton (who has been among the most vocal and vitriolic critics of embattled pharmaceutical company Valeant) – are sufficient to justify travelling to the southern hemisphere.
- Explore Categories
- Commentary
- Event
- Manager Writes
- Opinion
- Profile
- Research
- Sponsored Statement
- Technical